Our market update is a collaboration between the KraneShares internal research department and our industry-leading subadvisors and partners. Our research covers global growth themes in both public and private markets.
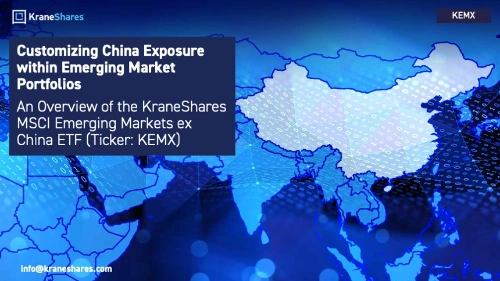
KEMX is benchmarked to the MSCI Emerging Markets ex China Index, which tracks large-cap and mid-cap companies within emerging market countries, excluding China. KEMX enables investors to build tailored Emerging Market (EM) portfolios when combined with exposure to China. KEMX can be paired with KraneShares China-focused core and thematic funds to establish strategic positions in China without duplicating exposures.
KEMX Features:
Exposure to large-cap and mid-cap companies within emerging market countries, excluding China
Benchmarked to MSCI, a global leader in international indexing
By pairing KEMX with other KraneShares China-focused funds, investors can employ the following strategies to customize their allocation to China:
China Core: Exposure to the full range of publicly listed Chinese companies across the Mainland, US, and Hong Kong Stock Exchanges
China Core-Thematic: Broad China exposure enhanced by specific sector or investment themes
China Thematic: Focused exposure to specific sectors or themes in China
China Tactical: Ability to dynamically adjust China’s weighting within an Emerging Market portfolio
The ETF’s 30 Day Median Bid-Ask Spread is calculated by identifying the ETF’s national best bid and national best offer ("NBBO") as of the end of each 10 second interval during each trading day of the last 30 calendar days and dividing the difference between each such bid and offer by the midpoint of the NBBO. The median of those values is identified and that value is expressed as a percentage rounded to the nearest hundredth.
The Premium/Discount History chart demonstrates the difference between the daily market price of shares of the Fund and the Fund’s net asset value (NAV). The vertical axis of the chart shows the premium or discount of the daily market price as a percentage of the NAV. The horizontal axis shows each trading day in the time period, and each data point in the chart represents the Premium/Discount on that day. The data presented in the chart and table above represent past performance and cannot be used to predict future results.
Performance History
Cumulative %
Data as of: 06/30/2026
Fund NAV
Closing Price
Underlying Index
1 Month
-0.46%
1.39%
0.03%
3 Month
32.64%
29.40%
34.53%
6 Month
37.75%
41.50%
38.78%
YTD
37.75%
41.50%
38.78%
Since Inception
155.56%
160.64%
146.71%
Avg Annualized %
Data as of quarter end: 06/30/2026
Fund NAV
Closing Price
Underlying Index
1 Year
64.52%
68.14%
63.11%
3 Year
28.47%
29.02%
28.34%
5 Year
13.33%
13.97%
13.19%
Since Inception
13.87%
14.18%
13.31%
*Fee waivers are contractual and in effect until August 1, 2026
The performance data quoted represents past performance. Past performance does not guarantee future results. The investment return and principal value of an investment will fluctuate so that an investor's shares, when sold or redeemed, may be worth more or less than their original cost and current performance may be lower or higher than the performance quoted.
Distribution History
2025 Distributions
Ex-Date
Record Date
Payable Date
Amount
12/22/2025
12/22/2025
12/23/2025
1.174425
12/30/2025
12/30/2025
12/31/2025
0.041758
Future calendar dates are subject to change. There is no guarantee that dividends will be paid. Past distributions are not indicative of future trends. This material is provided for educational purposes only and does not constitute investment advice.
Distributions are issued to brokers on the payable date, and are subject to broker payment schedules.
The Growth of $10,000 chart reflects an initial investment of $10,000 on the day prior to the selected time period and assumes reinvestment of dividends and capital gains. For the growth of $10,000 chart since inception, the initial investment of $10,000 is instead made on the inception date of the Fund. Fund expenses, including management fees and other expenses were deducted. The growth of a $10,000 investment in the fund is hypothetical and for illustration purposes only. Fund performance data used in this chart is based on Fund NAV and represents past performance. Past performance does not guarantee future results.
Hyperlinks on this website are provided as a convenience and we disclaim any responsibility for information, services or products found on the websites linked hereto.
You are now leaving KraneShares.com. Hyperlinks on these websites are provided as a convenience and we disclaim any responsibility for information, services or products found on the websites linked hereto.
For questions on how to invest in KraneShares ETFs, please refer to ETF Trading 101.